Presentation
The Dashboard is a central page. This is your personal hub, giving you an overview of your collections and transactions. Designed to simplify your user experience, the Dashboard brings together all essential information.
You’ll find a summary of your recent interactions on the site. Clear, concise statistics let you track your actions and the value of your collections at a glance.
Ready to get started? Dive into your Dashboard right now and discover the presentation of the different widgets that make up the Dashboard.
Actions
Update
If, in the settings page, you have selected the automatic update option, you don’t need to do anything. The page will be updated as soon as you view it.
When displaying the dashboard, the system performs numerous calculations and queries the APIs to retrieve the latest price and availability data. When your collection becomes important, the loading time of the Dashboard page can become significant. It is therefore advisable to deactivate the automatic update option. You will then need to click on the Refresh button at the top right of the dashboard to update it.
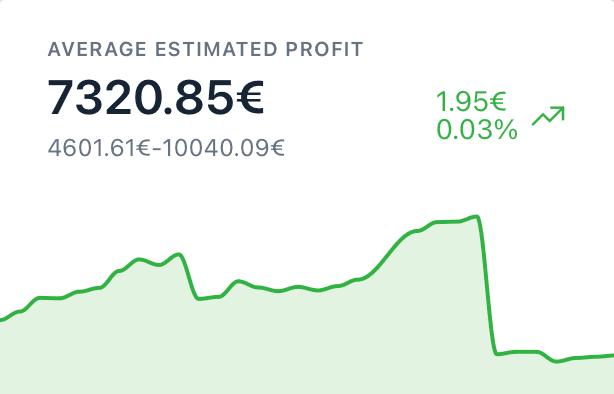
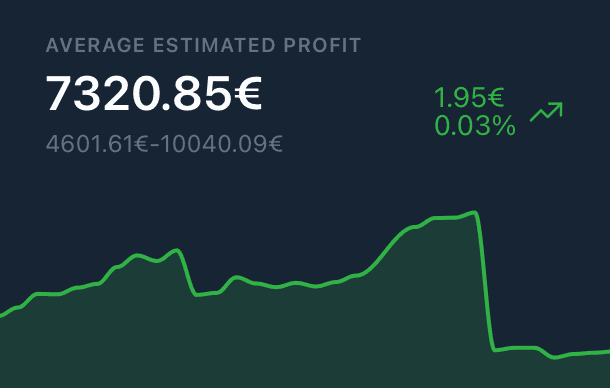
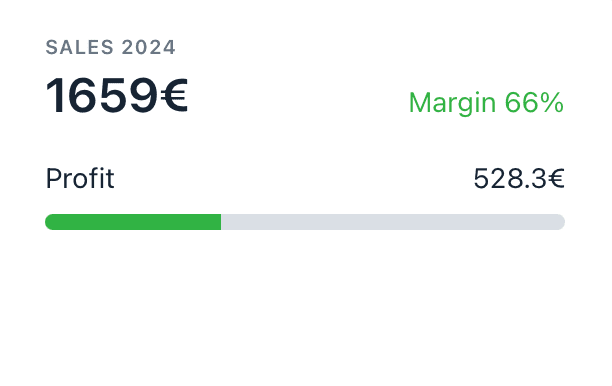
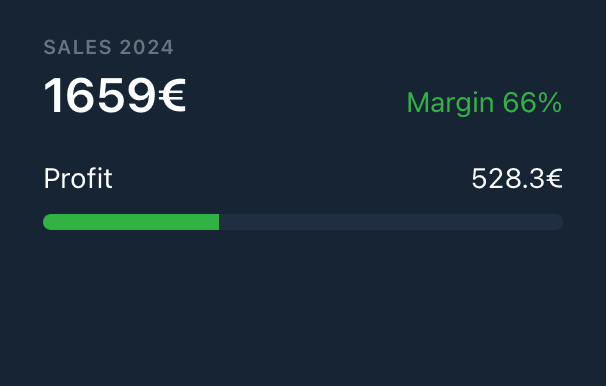
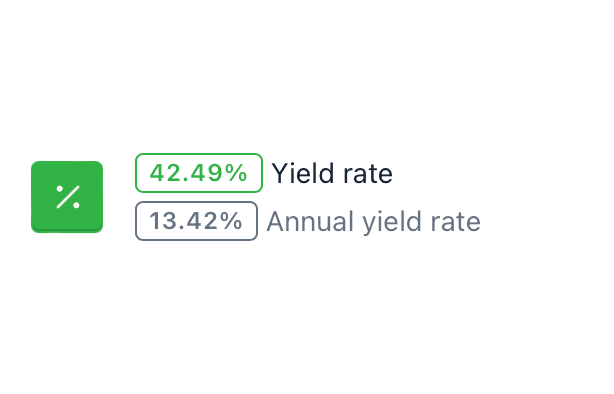
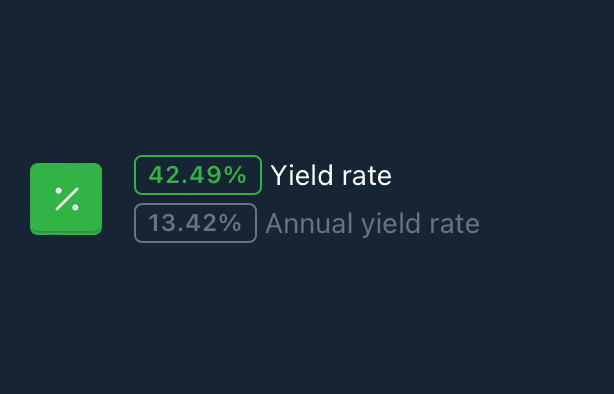
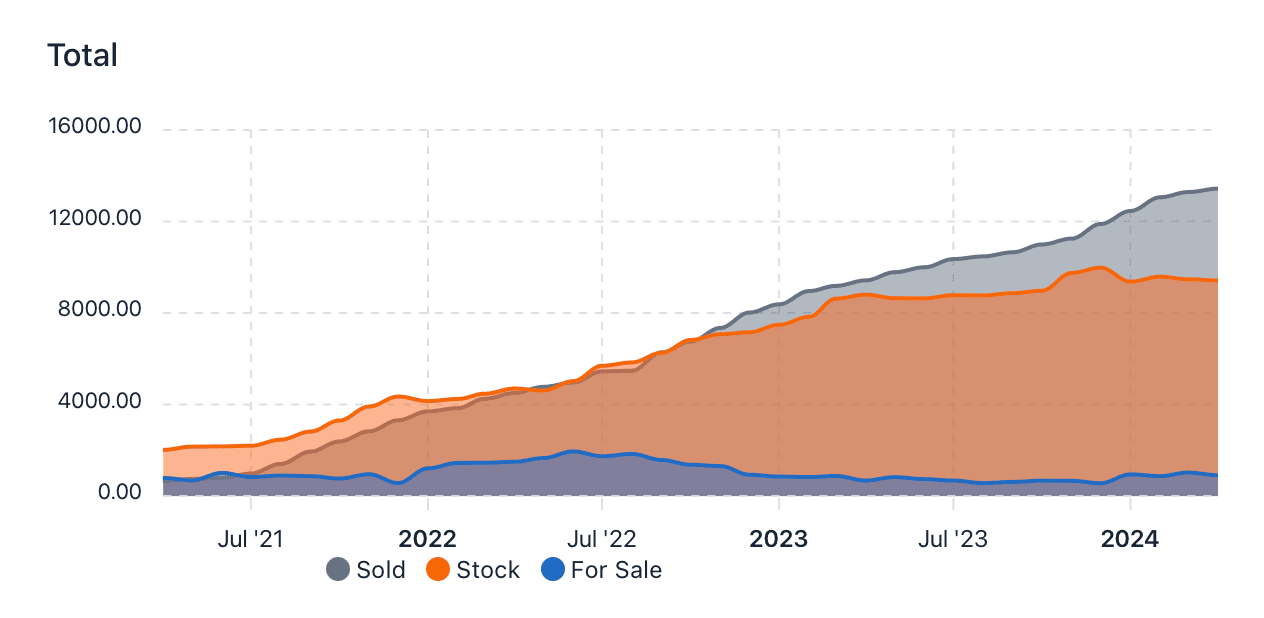
Widgets make up your dashboard. Made up of figures and graphs, they give you an overview of your collection. Below is a description of the main widgets that make up the dashboard.
The graphics are interactive. You can click on them to see the different values. For graphs with a legend, click on it to select the curves to be displayed.