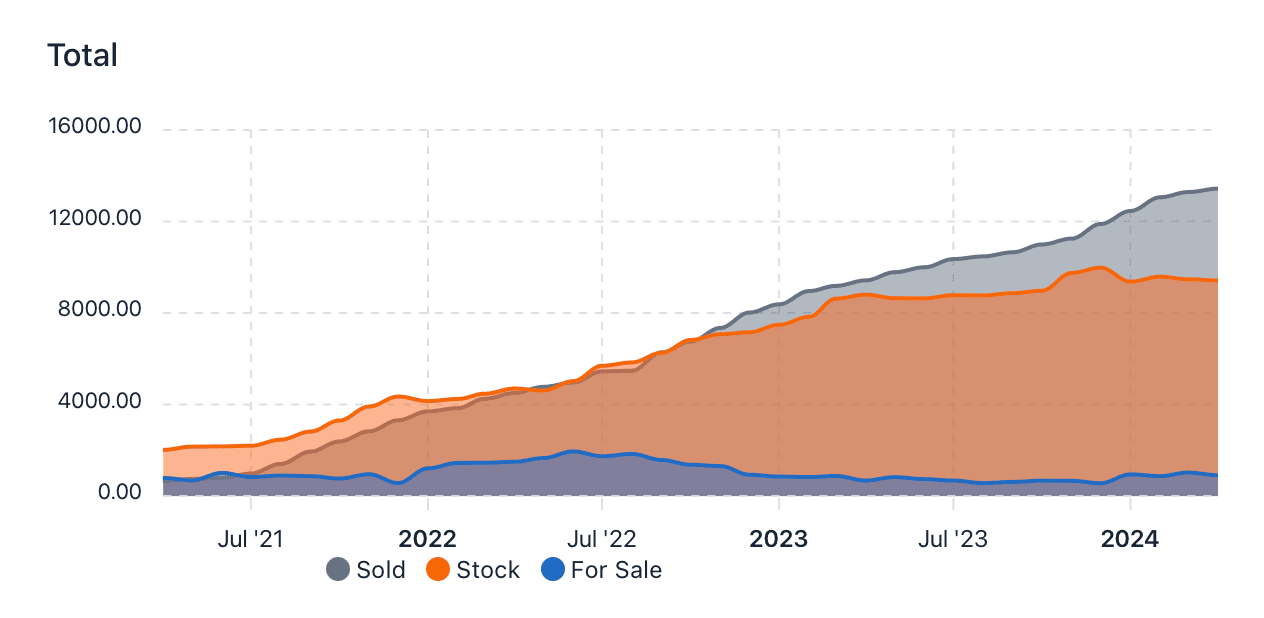

- Sold =
Selling priceof sold items +Selling priceof bulk items - Stock =
Advised selling priceof items currently in stock - For sale =
Price offered for saleof items currently for sale
Total chart
Selling price of sold items + Selling price of bulk itemsAdvised selling price of items currently in stockPrice offered for sale of items currently for sale